1. Introduction to Multiphase flow meter (MPFM)
A Multiphase flow meter in the Oil and Gas applications can measure the three phase flow (gas, Hydrocarbon liquid, water) without any so called separation by the process separators. The flow meters produce output flow rates for all the three components.
The design and engineering of a MPFM is done with respect to the application and the well data or the three phase fluid data. The design also takes care of the changing scenarios, i.e. the change of well fluid physical properties with the time.
1.1 Application of Multiphase flow meter (MPFM)
MPFMs are used before the Hydrocarbon fluid is separated in the process separators and before the fluid is comingled with the fluids from different wells. The MPFMs are placed closed to the wells or the well clusters. This helps to determine well fluid properties realistically by providing data to the reservoir engineering.
It is possible to separate the fluid in three distinct streams (gas, oil, water) by a ‘test separator’, but it does not allow to measure the fluid flow in the conditions it comes out of the well and thus cannot provide a true profile of the well fluid.
1.2 Principles of Measurement And Technologies of Multiphase flow meter (MPFM)
A multiphase flow meter measures the velocity of each phase, i.e. VO, VG, VW velocity of oil, gas and water respectively. It also measures the cross-section occupied by each phase.
Thus if FO, FG, FW are the ratio of the cross-section occupied by oil, gas and water respectively to that of the pipe (i.e. phase area fractions), then
QO = A FO VO, QG = A FG VG, QW = A FW VW, and FG + FO + FW = 1, where QG, QO, QW are the volumetric flow rate of gas, oil and water respectively. A= Pipe cross-section.
Thus a number of methods or technologies are available in the range of MPFM products to determine the phase velocities and the phase area fractions.
1.3 Measurement of Phase Fraction
1.3.1 Single γ-ray method
This method is applied for two phase fluid. Let us consider a case of oil and water flow.
γ ray is attenuated when it passes through a substance. The attenuation is different in different materials. Attenuation coefficient of γ ray is established by the reservoir engineers or by the MPFM supplier.
Following is an attenuation equation:
IM= CIV*exp[-d(FOUO + FWUW)]
IM= Intensity measured, or measured count rate of the radiation measured in a two phase multiphase fluid.
C= A constant whose value depends on the source of radiation and geometry.
IV = Count rate measured in identical conditions but when the pipe is evacuated.
F = volume fraction (O = oil, W=water)
U= linear attenuation coefficient of γ ray (o = oil, w=water)
d= pipe internal diameter.
Now, U for oil or water can be determined by measuring IM when the pipe is filled completely with either oil or water respectively (F = 1 in this condition; C can be determined by experiment).
Thus if UO and UW are known then from equation 1 it can be written by using the relation
UO + UW = 1,
FW = [ln( IO)-ln (IM)]/[ln(IO)-ln(Iw)]
Thus both the volume fractions for water and oil can be determined. This technique can be applied to two phase consisting of gas and liquid also.
1.3.2 Dual γ-ray method
This method is required for determining the phase fractions if the fluid consists of gas, oil and water.
For three phase the attenuation equation becomes:
IM= CIV*exp[-d(FGUG + FOUO + FWUW)
IM= Intensity measured, or measured count rate of the radiation measured in a two phase multiphase fluid.
C= A constant whose value depends on the source of radiation and geometry.
IV = Count rate measured in identical conditions but when the pipe is evacuated.
F = volume fraction (O = oil, W=water, G=Gas)
U= linear attenuation coefficient of γ ray (O = oil, W=water, G=Gas)
d= pipe internal diameter
As this is a equation with three variables, FG, FO, FW, three equations are required to determine the values. Since the linear attenuation coefficient μ varies with the energy of γ-ray, a second equation similar to equation 2 above is established by using a second source of γ-ray.
The third equation is, FG + FO+ FW =1.
Thus the volume fractions can be determined.
The γ-ray method can be applied to 0-100% gas void fraction and 0-100% water cut.
The change in the salinity of water affects the linear attenuation coefficient of γ-ray and thus affects the accuracy. It may be noted that the salinity change also affects the other methods of determining volume fractions. A multiple energy γ-ray absorption technology is available to compensate for salinity change.
1.3.3 Electrical impedance method
In this method the electrical conductivity and permittivity are measured across the pipe cross-section. The electrical impedance measured across the pipe cross section is the resultant impedance due to the gas, oil and water. Thus by measuring the impedance it is possible to measure the volume fractions. The relationship between fluid fractions and the electrical impedance is very complex. The electrical impedance is measured at a given frequency. The fractions are determined from look up table.
Sophisticated models are employed to determine the phase fractions from sensor (electrode) geometry and fluid flow.
1.4 Measurement of Phase Velocity and Volume Flow
1.4.1 Measurement by Venturi Meter
ISO 5167, Part 3 does not include the measurement of multiphase flow rate by a Venturi meter however it is possible to measure the multiphase volumetric flow by measuring the differential pressure across the Venturi meter throat. Enhanced or modified ISO equations are used as developed by the manufacturers.
If the flow is well mixed or homogeneous from the venturi meter the bulk velocity of the multiphase fluid is known. If the flow is non-homogeneous then also the gas and liquid velocity can be established if the gas fraction is known by the determination of phase fraction as described in section 6.3.
1.4.2 Measurement By Cross Correlation Method
In this method the velocity of propagation of a particular physical property of the fluid (say density or dielectric constant) is measured. Two sensors are used to measure the variation in a particular physical property of the flowing fluid. The sensors are located along the pipe at a fixed distance. If both the sensors detect a similar variation in the physical property over a time interval T, then L/T is the velocity of the particular fluid. It should be noted that this technique measures the change (signal signature) and not the absolute value. For example the sensors can be conductivity sensor, and using a high frequency signal the shift in conductivity value can be detected by the first sensor, after a time interval ‘T’, the same shift is detected by the second sensor. Thus, L/T will represent the velocity of a phase say oil or water.
The graph below indicates the technique.
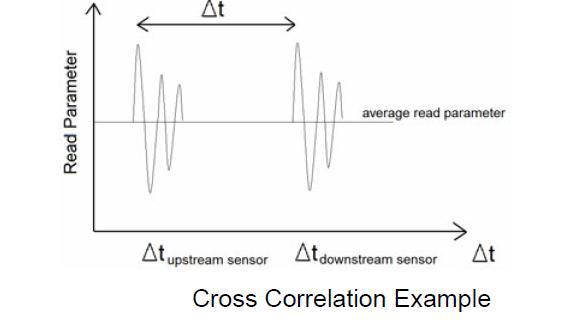
Cross corelation example
Mathematically a cross co-relation function is defined and the time lag or ‘T’ at which the cross co-relation is maximum is taken to calculate the velocity.
It is to be noted that the cross co-relation technique does not take care of the slip, i.e. it makes the measurement in the dispersed phase of the mixture. If there is a slip or velocity difference between gas and liquid then this will lead to error and thus to reduce error knowledge of slip is required.
A common feature is to use the cross co-relation technique along with the Venturi meter.
Cross co-relation is also used as a standalone method for determining velocity.
1.4.3 Positive Displacement (PD) meters
Sometimes, PD meters are also used to measure the volumetric flow rate as the meter characteristically captures a predefined volume at the inlet and delivers it to the outlet.
In MPFM application it will measure the total volume of the multiphase fluid.
1.5 Multiphase Flow Meter Selection
1.5.1 Gas volume fraction scenarios
The overall multiphase flow scenarios can be described by flow regimes and production envelopes.
A Multiphase flow may exhibit many patterns based on the fractions of gas, oil and water in the fluid and the flowing conditions. A fluid can be characterized by the GVF. More the GVF more is the gas in the fluid. Thus the type of the meter and the application criteria is governed by GVF.
Following table describes how single phase flow meter, a multi-phase flow meter and a wet gas meter is relevant with respect to GVF.
| Low GVF | 0-25% | Traditional single phase flow meters can perform well at lower GVFs and accuracy decreases with increasing GVF. MPFM performs well. |
| Moderate GVF | 25%-85% | Traditional single phase flow meters cannot perform, MPFM performs well within this range. |
| High GVF | 85%-95% | The uncertainty of the MPFM increases due to high GVF. For this reason sometimes a partial separation is done within the MPFM to achieve an acceptable GVF. |
| Very high GVF |
95%-100% | In the lower part of this range, the MPFM can still be used (as stated above) for well testing and management. At the higher part of this range, the gas is ‘wet gas’ and wet gas meters should be used. |
1.5.2 Flow Regimes and Production Envelopes
1.5.2.1 Flow Regime
For wellhead applications, typically the pipe lines are horizontal. In such application the flow regime is not affected by transient conditions. Transient condition means those which change the ‘system boundary conditions’, for example the close and opening of a valve.
Also, such flow is not affected by the geometry and terrain effects due to change in pipe line geometry. Such change of geometry may result in slugs but the locations of MPFM in the present context do not see such effects.
In these circumstances the steady state flow regime is only governed by the flow rates, fluid properties, pipe inclination and pipe diameter. This kind of flow regime is called ‘hydrodynamic flow regime’ and is typical in wellhead applications.
The flow regime can be classified into the following groups (see ‘Definitions’ section above)
- · Dispersed
- · Separated
- · Intermittent
It must be noted that the gas liquid interactions have more pronounced effect in the flow regime. The effects of liquid (oil)- liquid(water) interaction are usually not significant and thus in MPFM applications many a times liquid-liquid regime is considered as dispersed flow.
Typical flow regime envelope is as below;
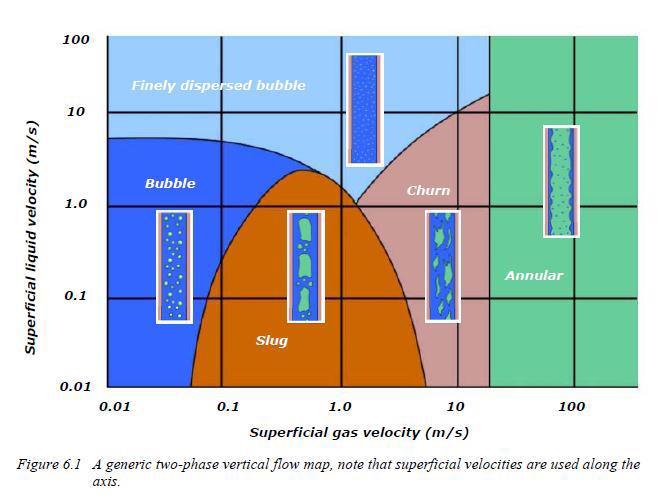
Vertical flow map
1.5.2.2 Production Envelope
In production envelope, the actual gas and actual liquid flow rate are plotted along the X and Y axis rather than the superficial velocity as done in Flow regime graphs.
The production envelopes use logarithmic scale and not linear scale as used in flow regime envelopes.
Typical production envelope is shown in Figure below;
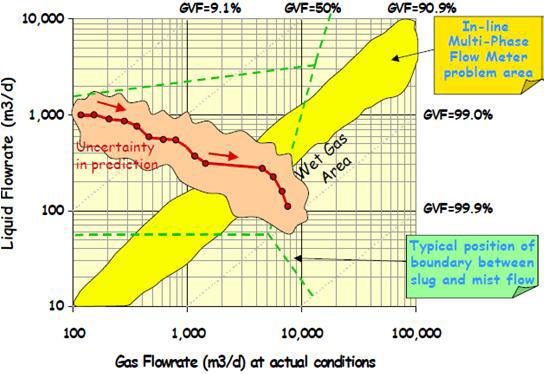
Gas flowrate
It is to be noted that the flow boundaries (i.e. from stratified to slug or from slug to annular) depends on the pipe size, i.e. may change if there is a change in the pipe size.
Also, the flow boundaries are dependent on density, surface tension, pressure, geometry of conduit, pipe inclination or terrain.
The gas and liquid flow rates plotted in the production envelopes are based on predicted flows over a time (typically three decades). Thus the way the gas and liquid flow will follow with time or the well trajectories are shown in the production envelopes. As these are based on initial well data, the uncertainty in the trajectories could be as high as 10 to 25% and thus the MPFM flow envelope should cover the production envelope considering the above stated uncertainties.
1.5.3 Well PVT Data
Before the selection and design of MPFM it is necessary to know the fluid data (the physical properties, relative amount of gas, oil and water) of the Wells. Such data are commonly called PVT data (pressure-volume-temperature data) in reservoir (well) engineering.
The well samples (consisting of gas and liquid) are collected and tested as per the established procedures in reservoir engineering. From the PVT data, PVT properties (see bullet points listed below) are calculated in a PVT simulation programme based on the total hydrocarbon content and displayed as a pressure and temperature dependent look up table.
Followings are some typical process parameters which are required for designing or selecting a MPFM:
- · Pressure
- · Temperature
- · Density (for every phase)
- · Viscosity (for every phase)
- · Water conductivity
- · Permittivity of oil
- · (γ-ray)Linear or mass attenuation coefficient per phase
- · Salinity
- · Sand, particulate
- · Water cut (ratio of water to oil)
The well data are used to develop production envelope which shows the flow regimes over the time. Usually, the project feasibility report or the feed documents of an upcoming upstream Hydrocarbon facility will have reservoir or well fluid data and predictive data variation over say three decades. Thus the above listed data are required by the supplier along with the expected flow regime (see section 5.2 above) and or production envelope to make a correct design of the MPFM.
1.6 Different Types Of Multiphase Flow Meter (MPFM)
Following different type of MPFMs are being currently used in industry.
- · Separation Type Meters (where phases are separated before flow rate measurement)
- · Wet gas meters
- · In Line meters
1.6.1 Separation Type Meters
1.6.1.1 Partial Separation, Separation In Sample Line
In some multiphase flow meter, a partial or limited separation technology is applied, i.e. the phase fractions and phase velocities are not all measured over the entire flow. Here the gross volume flow is measured as well as the gas and liquid fractions are determined over the main flow. This is usually done by employing single γ ray source as described earlier. Next, (as shown in the attached figure), the gas is separated from the liquid in a bypass line. The separated liquid stream is passed through a mixer (for proper mixing of oil and water).Then water is measured in the hydrocarbon liquid to determine the water fraction (water cut).
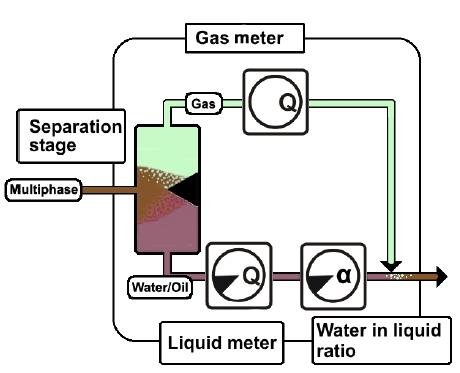
Gas liquid meter
The gas stream which is separated from the liquid is measured for volumetric flow rate by a separate flow meter which could be a Vortex flow meter or another Venturi meter.
For measurement of water fraction analyzers are available based on ‘electrical impedance measurement’. This is normally based on Capacitance measurement or RF permittivity measurement. However, if water is the dominant phase, then the measurement is done by measuring electrical conductivity. Salinity of water affects the accuracy based on permittivity measurement (Capacitance or RF permittivity). Water-cut measurement based on NIR (near Infra red) absorption technology is not affected by salinity.
1.6.1.2 Gas and Liquid separation type
In some flow meters, the gas is separated from the liquid. The gas still carries some liquid and is of the ‘wet gas category’. The gas flow rate is then measured by the use of wet gas flow meter. The remaining part of the multiphase flow stream will be having low GVF and thus can be measured accurately by applying one of the techniques of multiphase flow measurements.
1.6.2 Wet Gas Meters
A gas is considered as wet when the Lockhart-Martinelli (LM) number is less than 0.3(approximately 10% free liquid by volume). Atypical example of wet gas is Separator gas outlet. Also, some wells where GVF is very high (95% to 100%) the multiphase fluid can be considered as a wet gas.
One method of measuring wet gas is by single phase flow meter like Venturi Meter or Vcone.
In this kind of application with a single phase meter, the wet gas flow is derived by using various models and by applying correction factors to take into account the presence of liquid in gas.
LGR (Liquid Gas Ratio) affects the differential pressure (dp) measurement. The raw dp value is corrected in the flow computer by suitable algorithm.
The MPFMs are also used for measuring wet gas instead of single phase meters described above. There are Wet gas meters which can discriminate between the ‘produced water’ and the ‘formation water’ by measuring the salinity.
Following outputs are provided by a wet gas meter (i.e. where GVF is very high).
- · Gas and Liquid flow rates (or)
- · Gas and Water flow rates (or)
- · Gas, Oil and Water flow rates
1.6.3 In-line Meters
In these meters the phase fractions and the phase flow rates are directly measured. The phase fractions can be measured by γ-ray technique or by measuring electrical impedances. Phase velocities or phase volume flow rates are measured by Venturi meter and Cross correlation techniques. All these have been described in the earlier sections.
1.7 Measurement of Density of Fluid
Usually if γ ray is employed to measure the phase fractions or to measure velocity of the phases by cross co-relation method, the same γ ray source and detectors can be used to measure the density of gas, oil and water.
1.8 Performance Specifications
As MPFM is a complex measurement system and as it is supposed to operate with well fluids from different reservoirs and over several years, the performance specification is very critical.
Following is a listing of the performance parameters.
1.8.1 Phase Envelope
As defined in earlier section, the measuring envelope (also called phase envelope) is the graph of two phase flow scenarios over which a MPFM will work. It is necessary to get the phase envelope from the supplier and to review whether the flow scenarios confirmed or predicted by the reservoir engineering group fall within the measuring envelope provided by the supplier.
Typical measuring envelopes are shown in the figure below,
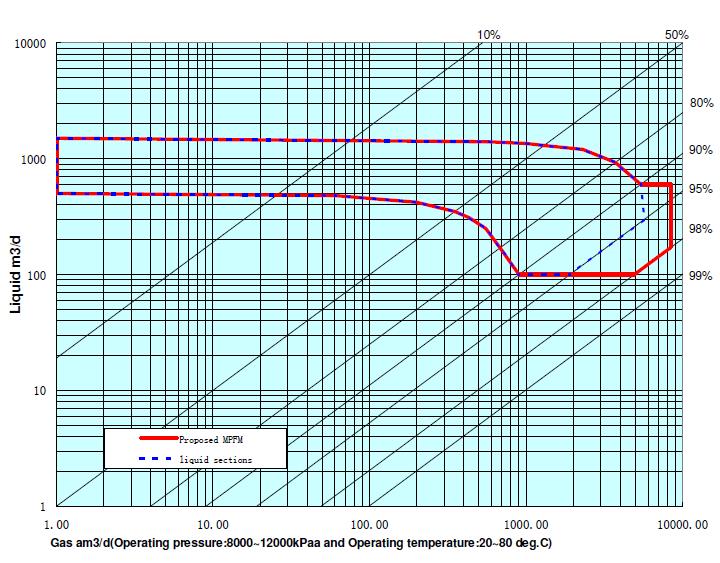
Measuring envelopes
1.8.2 Measurement Uncertainty
Factors those influence measurement are as listed below.
- · Measuring ranges and limiting/design conditions.
- · Material specifications
- · Specifications of secondary instruments like Pressure transmitters, Temperature transmitters
- · Specifications of γ-ray meters, electrical impedance meters, densitometers
- · Specifications of piping components like piping valves, mechanical equipment like Hydro cyclone (used for separation of gas from condensate). Mixer (used for mixing oil and water).
Though quantitative evaluation of uncertainty is done by the manufacture but it is quite complex and cannot be fully determined by calculation as there are several items involved in the measurement process. These items include measuring instruments (sensors and transmitters), separating equipment, mixers, empirical or mathematical models.
Moreover, it must be understood that a quantitative evaluation of uncertainty does not serve the purpose completely as the uncertainty of the measuring meters are related to the flow conditions and regimes which could not be quantified very correctly.
Thus the uncertainty is verified by testing in laboratories and usually in third party’s test laboratories. The default confidence level for stating uncertainty is 95% and the confidence level must be stated in the uncertainty statement. Flow rates are normally specified with relative uncertainties (in %). Phase fractions are specified with absolute uncertainties. API RP 86 describes in details the Uncertainty and Performance evaluation/measurement of MPFMs.
1.8.3 Output specifications
Normally a MPFM will produce the following outputs as a minimum:
- · Volume flow rates of Gas, Oil and Water
- · Mass flow rates of Gas, Oil and Water
- · Phase volume fractions, GVF and WLR
- · Pressure, Temperature
Additionally it will be helpful if time related performances are specified
- · Response time for variation in flow regime and condition
- · Response time to variation in fluid properties
- · Measurement cycle time
- · Aging or drift
1.8.4 Factors Influencing Performance
- · Flow regimes
- · Slip
- · Salinity variation
- · Variation in Viscosity/Density/Dielectric constant/Electrical conductivity
- · Sand
- · Pressure loss and Cavitations
- · Chemical injection additives like MEG, Methanol or wax inhibitor.
- · Scaling, wax deposition, hydrate formation
- · Vibrations
- · Installation effects, straight runs
- · Electro-magnetic interference