Introduction to SIL (Safety Integrity Level)
Terminologies
SAFETY: “Freedom from Unacceptable Risk”
ALARP : “As Low As Reasonably Practicable”
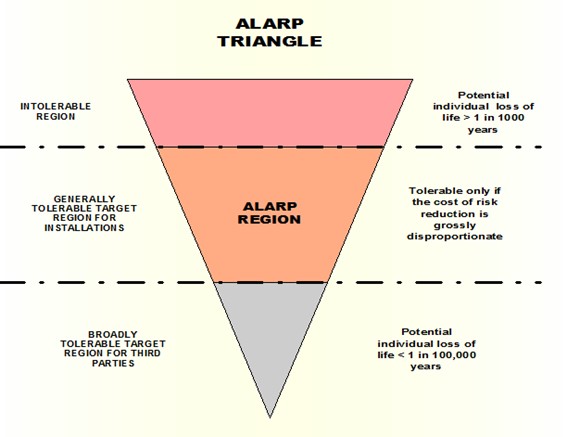
RISK: “Freqncy of occurrence of hazard causingharm and conseqnce of the harm”
Risk = freqncy x conseqnce
Safety Systems Engineering (SSE)
A disciplined, systematic approach encompassing hazard identification, safety requirement specifications, safety system design, building, operation and maintenance over the entire lifetime of the plant.
Safety methods employed
- Changing the process or design
- Increasing mechanical integrity
- Improved Basic Process Control System (BPCS)
- Better training & operational procedures
- Using Safety Instrumented Systems (SIS)
- Installing mitigating equipment
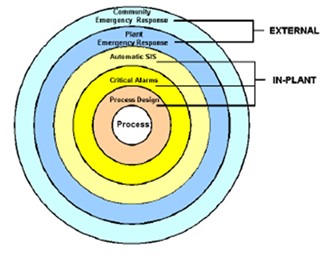
Safety Protective Layers
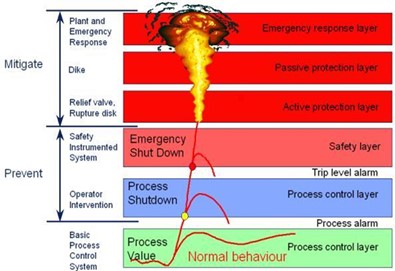
Prevention & Mitigation
Safety Instrumented System (SIS)
System composed of sensors, logic-solvers and control elements to take the process to a safe state when predetermined conditions are violated.
Purpose of SIS
An SIS is designed to:
- respond to conditions in the plant which may be hazardous in themselves
- if no action was taken, could eventually give rise to a hazard, and
- To respond to these conditions by taking defined actions that either prevents the hazard or mitigates the hazard conseqnces.
- The SIS is of the pattern:
Input —- Logic Solver —- Output
Safety Integrity Level (SIL)
It is a statistical representation of the availability of SIS at the time of process demand.
It is a measure of the potential risk to people, environment or process in the event of a malfunction.
Considerations for a particular SIL:
- Potential risk to personnel, and the number of personnel, who would be affected, if the protective instrument system were to fail.
- Potential environmental damage which needs to be taken very seriously, particularly if it extends outside the factory fence.
- Potential financial loss which might be suffered if the system were to fail. This includes actual damage to the plant, but is very likely to also include conseqntial loss of production d to a shutdown.
Need for SIL
- ISA S84.01 and IEC 61508 require that companies assign a target SIL for any new or retrofitted SIS.
- The assignment of the target SIL is a decision requiring the extension of the Process Hazards Analysis (PHA).
- The assignment is based on the amount of risk reduction that is necessary to mitigate the risk associated with the process to an acceptable level.
- All of the SIS design, operation and maintenance choices must then be verified against the target SIL.
Factors considers for SIL assessment:
- Device Integrity
- Diagnostics
- Systematic & common cause failures
- Testing
- Operation
- Maintenance
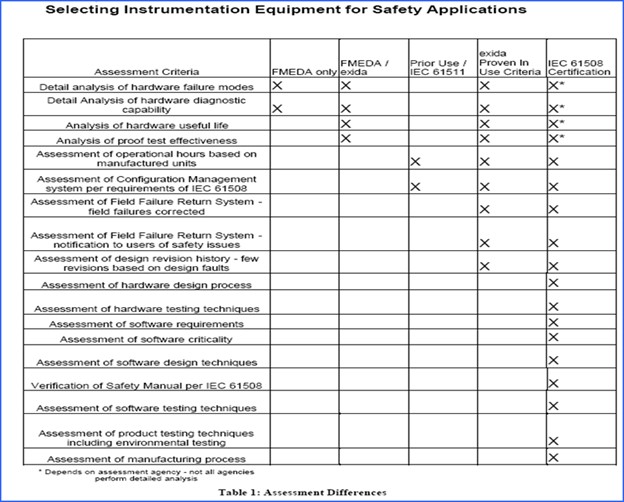
Evaluating the SIL of a system:
Assessment normally done by third party experts, such as
- exida
- TUV
- FM
- Lloyds Register
Important Standards & Regulations
- IEC 61508:Functional Safety of Electrical/Electronic/Programmable Electronic Safety-Related Systems, Parts 1-7
- IEC 61511:Functional SIS for the Process Industry Sector, Parts 1-3
- ISA S84.01:Application of Safety Instrumented Systems for the Process Industries
- JIS C0508
Safety Life Cycle model of IEC 61508
Structured, auditable management of safety related systems from concept right up to eventual decommissioning.
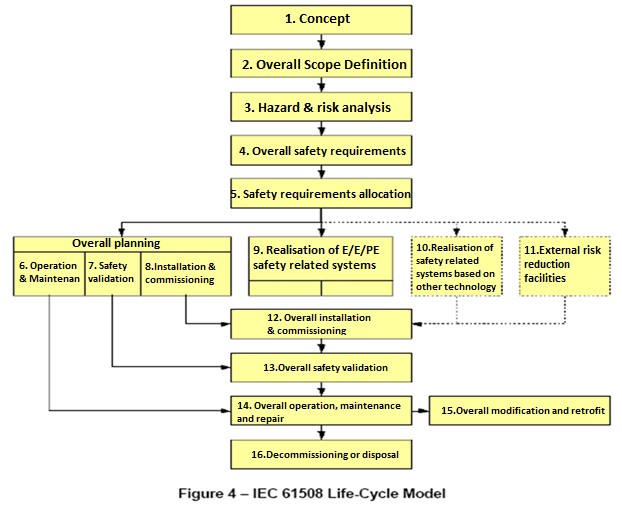
Safety Life Cycle model of IEC 61508
Safety Integrity Level Correlation with Availability and Probability to Fail on Demand (PFD)

Qualitative view of SIL

SIL 4: High Integrity Protective System (HIPS)
SIL 3/ SIL 2/ SIL 1: These three SILs require different designs of instrument andcontrolsystems to provide the SILrequired
Assigning a SIL:
Conduct a Process Hazard Analysis (PHA) by means of Hazard &Operatability Study (HAZOP) i.e. a systematic, methodical examination of the process design by a multi-disciplinary team to identify hazards and operatability problems that could result in an accident, and their probability.
HAZOP: Risk factors and probability in terms of severity & likelihood
On Site Conseqnces
- Worker injury or death
- Equipment damage
Off Site Conseqnces
- Community exposure including death/injury
- Property damage
Environmental Impact
- Emission of hazardous chemicals
- Contamination of air, soil, water
- Damage to environmentally sensitive areas
SIL Methodology:
- Modified HAZOP
- Conseqnce only
- Risk Matrix
- Risk Graph
- Quantitative Assessment
- Corporate Mandated SIL
1. Modified HAZOP Method
Based on analyzing the incident severity & likelihood.
-Subjective on the teams understanding & experience of the process risk and the acceptable risk tolerance of the company
2. Conseqnce only method
- Very conservative method
- Considers conseqnce of event
- Ignores event freqncy
- Used when process history is limited
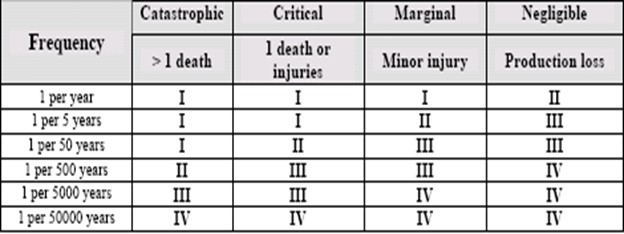
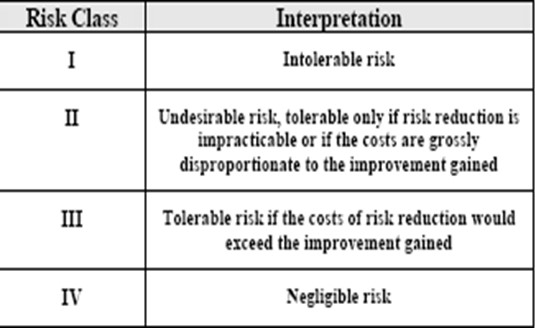
Fig: Typical Risk Classification of Accidents
3. Risk Matrix Method
- A commonly used method
- Correlates risk severity and risk probability
- Existing layers of protection taken into account
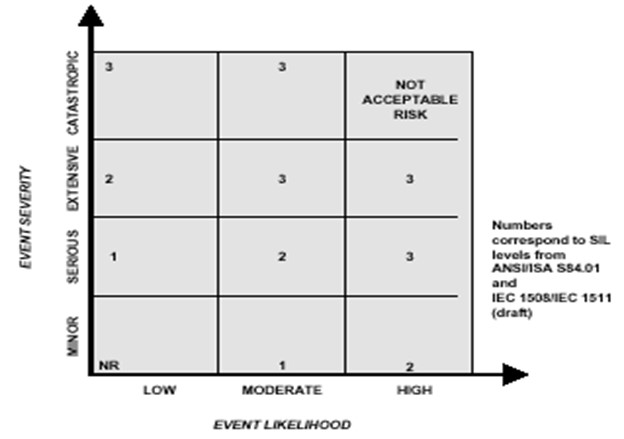
- Two-dimensional and Three-dimensional risk matrix
Two dimensional matrix
- A corporate risk matrix assigns SIL for a particular severity and probability.
- Does not take into account the existing layers of protection.
Three dimensional matrix
- Considers independent protection layers.
- Probability is done considering additional protection layers.
- Through understanding of process and risk required to use this method.
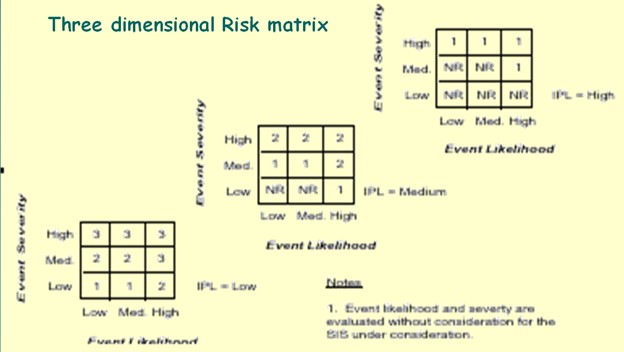
Three dimensional matrix
4. Risk Graph Method
- Qualitative method
- Four factors considered:
- conseqnce (C),
- freqncy and exposure time (F),
- possibility of avoiding the hazardous event (means of escape) (P)
- Probability of the unwanted occurrence (W).
- Tools must be developed separately to choose above factors.
- Both conseqnce & likelihood are determined considering the independent protective layers.
- Corporate Risk Graph must be developed.
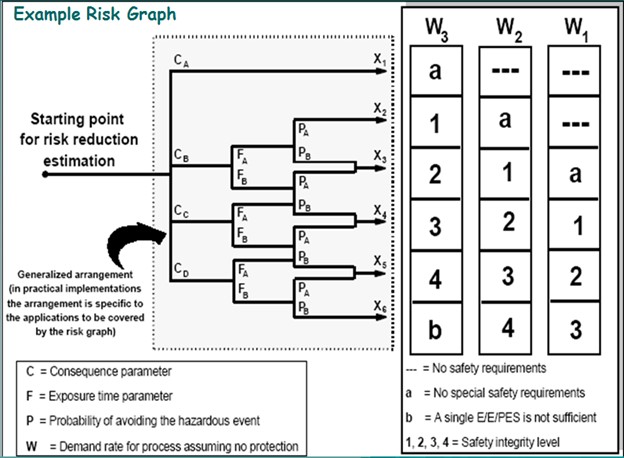
- The analysis proceeds with a determination of each of the parameters, in terms of levels shown as subscripted numbers. The Risk graph shown has
four levels for conseqnce,
two levels for freqncy,
two levels for possibility of escape,
three levels for likelihood.
- As the subscripted numbers increase, the perceived hazard is higher. Each of these levels must be carefully defined on a corporate basis.
- For the example Risk graph shown, the conseqnce levels are as follows:
C1 = Minor injury
C2 = Serious permanent injury to one or more persons
C3 = Death to several people
C4 = Very many people killed
- For the exposure freqncy, F, the process unit must be evaluated in terms of the personnel presence and activity in the unit.
- For the example Risk graph, F1 is chosen for rare to more often exposure in the hazardous zone and F2 is chosen for freqnt to permanent exposure in the hazardous zone.
- Possibility of escape, P, must consider time to escape as well as existence of unobstructed, well-indicated, well-lit escape paths.
- The example Risk graph uses P1 for possible under certain conditions and P2 for almost impossible.
- The probability of occurrence, W, is based on the likelihood of the event, which should be evaluated without taking into account any existing safety instrumented systems.
- For the example Risk graph, the probability for occurrence is based on the following:
W1 = A slight probability
W2 = A medium probability
W3 = A high probability
5. Quantitative Assessment
- The quantitative approach to SIL assignment is the most rigorous techniq to utilize.
- The SIL is assigned by determining the process demand or incident likelihood quantitatively.
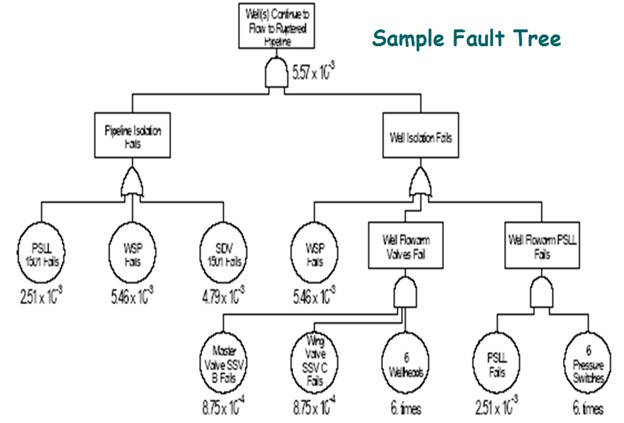
- The potential causes of the incident are modeled using a quantitative risk assessment techniq, such as, a fault tree.
- The quantitative techniq is often used when there is very limited historical information about the process, so that the qualitative determination of likelihood is extremely difficult.
- The method requires a thorough understanding of the potential causes of the event and an estimated probability of each potential cause
- To determine the required SIL, the accepted or tolerable risk freqncy is divided by the calculated process demand as follows:
Probability to Fall on Demand = Tolerable risk freqncy
Process demand
- The inverse of this equation has also been used to determine the risk reduction factor (RRF).
RRF = Process demand
Tolerable risk frequency
- Whichever equation is used, the calculated risk reduction equates to the required safety integrity level.
6. Corporate Mandated SIL
- The final techniq is the least time consuming method, which is one being adopted by many small, plants that do not wish to devote extensive manpower to SIL assignment methodologies.
- This method recognizes that the greatest increase in cost occurs when the decision is made that the SIL must be higher than SIL 1.
- The selection of SIL 2 or SIL 3 forces the SIS design toward device redundancy and diversity.
- With this recognition, many small companies are taking the approach that “a safety system is a safety system and therefore should be SIL 3”.
- This eliminates the arguments about whether escape is possible, someone will be injured or killed or the impact will be on-site and/or off-site. It saves time in the PHA process, reduces documentation in justifying the SIL choice.